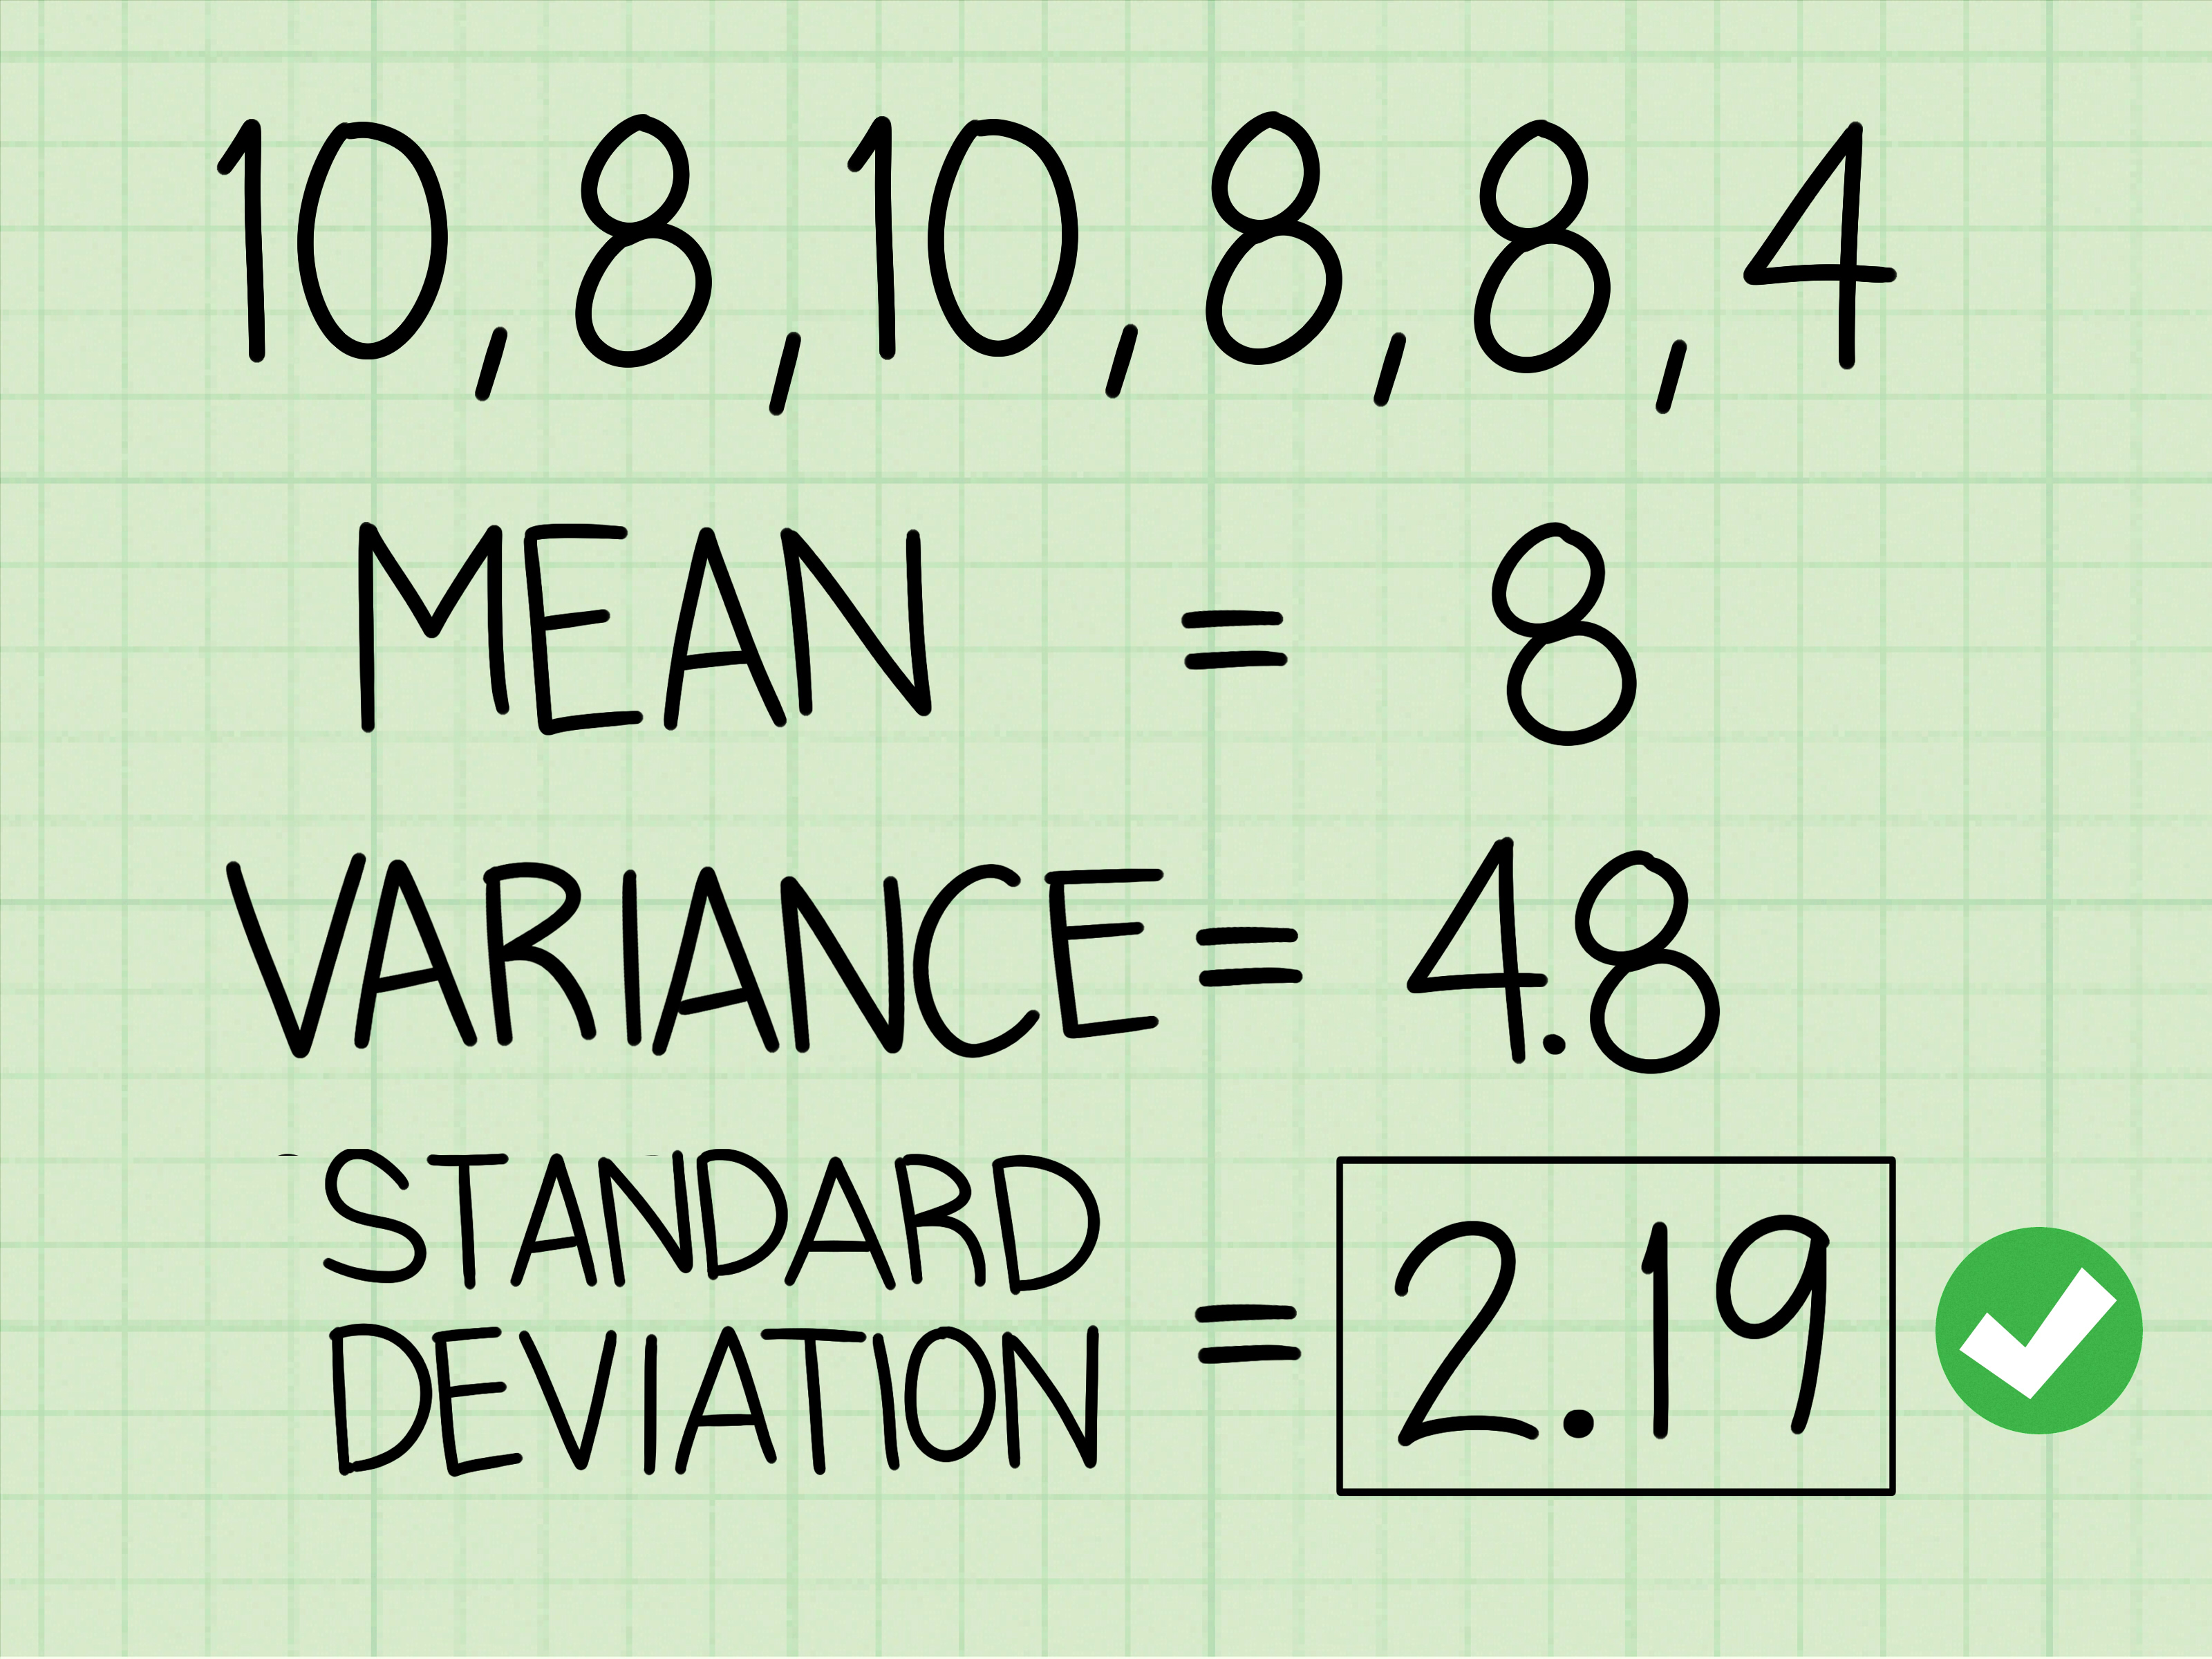
Note: This article is educational and synthesized from widely accepted statistics guidance used in U.S. learning resources, including NIST, Khan Academy, Penn State STAT, OpenStax, LibreTexts, and other reputable statistics references.
Standard deviation sounds like the kind of phrase that walks into a room wearing a lab coat and asking everyone to “show their work.” But the idea is much friendlier than it looks. In plain English, standard deviation tells you how spread out a set of numbers is. If the numbers huddle close to the average like penguins in winter, the standard deviation is small. If they scatter like students when the bell rings, the standard deviation is larger.
Knowing how to calculate standard deviation is useful in school, business, sports, finance, science, quality control, and basically anywhere numbers need a little adult supervision. It helps answer questions like: Are these test scores consistent? Are sales numbers stable? Is one player’s performance predictable? Is this data set calm, chaotic, or somewhere in between?
In this guide, you will learn how to calculate standard deviation in 12 clear steps, using formulas, examples, and practical explanations that do not require a PhD, a magic wand, or a calculator that looks like it can launch a satellite.
What Is Standard Deviation?
Standard deviation is a measure of variability. More specifically, it shows the typical distance between each value in a data set and the mean, also known as the average. A low standard deviation means the values are close to the mean. A high standard deviation means the values are more spread out.
For example, imagine two students take five quizzes:
- Student A scores: 80, 81, 79, 82, 78
- Student B scores: 60, 95, 70, 100, 75
Their averages might not be wildly different, but their consistency definitely is. Student A is steady, like a metronome with a backpack. Student B is more unpredictable, like a weather forecast in April. Standard deviation helps quantify that difference.
Population vs. Sample Standard Deviation
Before calculating standard deviation, you need to know whether your data represents a population or a sample.
Population Standard Deviation
Use population standard deviation when your data includes every value in the entire group you care about. For example, if you calculate the heights of every student in one small class, that class is your population.
The population standard deviation formula is:
σ = √[Σ(x - μ)² / N]
In this formula, σ is the population standard deviation, x is each value, μ is the population mean, N is the total number of values, and Σ means “add them all up.”
Sample Standard Deviation
Use sample standard deviation when your data is only part of a larger group. For example, if you survey 100 customers to understand all customers, you are working with a sample.
The sample standard deviation formula is:
s = √[Σ(x - x̄)² / (n - 1)]
Here, s is the sample standard deviation, x̄ is the sample mean, and n - 1 is used instead of n. That little “minus one” is called Bessel’s correction. It helps make the sample variance a better estimate of the population variance. In other words, statistics looked at a sample and said, “Let’s not get too confident, buddy.”
How to Calculate Standard Deviation: 12 Steps
Let’s walk through the process using this data set:
6, 8, 10, 12, 14
These numbers are simple enough to follow by hand, but the method works for larger data sets too.
Step 1: Write Down Your Data Set
Start by listing all the numbers clearly. For our example:
6, 8, 10, 12, 14
This may seem obvious, but clean data is the unsung hero of statistics. One missing value, typo, or accidental extra zero can turn a normal calculation into mathematical soup.
Step 2: Count the Number of Values
Count how many values are in your data set. In our example, there are five numbers:
n = 5
If you are calculating population standard deviation, you may use N. If you are calculating sample standard deviation, use n.
Step 3: Find the Mean
The mean is the average. Add all the values and divide by the number of values:
(6 + 8 + 10 + 12 + 14) / 5 = 50 / 5 = 10
So the mean is:
10
The mean is the center point of your data. Think of it as the data set’s favorite coffee shop where everyone agrees to meet.
Step 4: Subtract the Mean from Each Value
Now subtract the mean from every value. These results are called deviations.
6 - 10 = -48 - 10 = -210 - 10 = 012 - 10 = 214 - 10 = 4
The deviations are:
-4, -2, 0, 2, 4
Some deviations are negative because some values fall below the mean. That is perfectly normal. Negative numbers are not being dramatic; they are just doing their job.
Step 5: Square Each Deviation
Next, square each deviation. Squaring removes negative signs and gives more weight to values farther from the mean.
(-4)² = 16(-2)² = 40² = 02² = 44² = 16
The squared deviations are:
16, 4, 0, 4, 16
Step 6: Add the Squared Deviations
Add all the squared deviations together:
16 + 4 + 0 + 4 + 16 = 40
This total is called the sum of squares:
Σ(x - mean)² = 40
The sum of squares is the total squared distance from the mean. It is like measuring how far everyone wandered from the group photo spot.
Step 7: Decide Whether You Have a Population or Sample
This step determines what you divide by. If the data set includes every value in the group, divide by N. If the data set is only a sample, divide by n - 1.
For this example, let’s calculate both so you can see the difference.
Step 8: Calculate the Population Variance
For population variance, divide the sum of squares by the number of values:
40 / 5 = 8
So the population variance is:
8
Variance is important because standard deviation comes from it. However, variance is measured in squared units, which can feel awkward. If your data is measured in inches, variance is in square inches. That is why we take the square root next.
Step 9: Calculate the Population Standard Deviation
Take the square root of the population variance:
√8 ≈ 2.83
The population standard deviation is approximately:
2.83
Step 10: Calculate the Sample Variance
For sample variance, divide the sum of squares by n - 1. Since n = 5, then n - 1 = 4.
40 / 4 = 10
So the sample variance is:
10
This number is slightly larger than the population variance because sample data needs a little adjustment to better estimate the spread of a larger population.
Step 11: Calculate the Sample Standard Deviation
Take the square root of the sample variance:
√10 ≈ 3.16
The sample standard deviation is approximately:
3.16
Notice that the sample standard deviation is larger than the population standard deviation. That is expected because the sample formula uses n - 1, making the denominator smaller and the final result larger.
Step 12: Interpret the Result
Do not stop at the number. A standard deviation is only useful when you understand what it means. In our example, the sample standard deviation is about 3.16. That means the values typically vary by about 3.16 units from the mean.
If your data represents test scores, a standard deviation of 3.16 points means the scores are fairly close to the average. If your data represents daily sales in thousands of dollars, a standard deviation of 3.16 might matter a lot more. Context is the seasoning that keeps statistics from tasting like cardboard.
Quick Standard Deviation Formula Summary
| Type | Formula | When to Use |
|---|---|---|
| Population Standard Deviation | σ = √[Σ(x - μ)² / N] |
Use when you have every value in the full group. |
| Sample Standard Deviation | s = √[Σ(x - x̄)² / (n - 1)] |
Use when your data is a sample from a larger group. |
Why Standard Deviation Matters
Standard deviation is one of the most useful tools in descriptive statistics because it helps you understand consistency. Averages are helpful, but averages alone can hide surprises. Two data sets can have the same mean and very different spreads.
Imagine two online stores both average 100 orders per day. Store A usually gets between 95 and 105 orders. Store B gets 20 orders one day and 180 the next. Same average, very different business reality. Store A can plan staffing, inventory, and shipping more easily. Store B may need a stronger forecasting system, a better supply chain, or maybe just a calming cup of tea.
In education, standard deviation helps teachers understand whether test scores are tightly grouped or widely spread. In finance, it helps investors evaluate volatility. In manufacturing, it supports quality control by showing whether measurements stay within acceptable limits. In sports analytics, it can reveal whether an athlete is consistent or wildly unpredictable.
Common Mistakes When Calculating Standard Deviation
Using the Wrong Formula
The most common mistake is using the population formula when you should use the sample formula, or the other way around. If you are analyzing a subset of a larger group, use sample standard deviation. If you have the entire group, use population standard deviation.
Forgetting to Square the Deviations
If you simply add deviations without squaring them, positive and negative values cancel out. In fact, deviations from the mean always add up to zero. Squaring solves that problem and keeps the spread visible.
Confusing Variance with Standard Deviation
Variance and standard deviation are related, but they are not the same. Variance is the average squared deviation. Standard deviation is the square root of variance. Standard deviation is usually easier to interpret because it uses the original unit of measurement.
Rounding Too Early
Rounding after every step can make your final answer less accurate. Keep several decimal places during the calculation, then round your final standard deviation to a reasonable number of digits.
How to Calculate Standard Deviation in Excel or Google Sheets
You can calculate standard deviation by hand, but spreadsheets are much faster for large data sets. In Excel or Google Sheets, use:
=STDEV.S(range)for sample standard deviation=STDEV.P(range)for population standard deviation
For example, if your data is in cells A1 through A5, you can type:
=STDEV.S(A1:A5)
or:
=STDEV.P(A1:A5)
The spreadsheet will do the arithmetic instantly, which is lovely because life is short and nobody needs to manually square 400 deviations before lunch.
How to Explain Standard Deviation in Simple Words
Here is the simplest way to explain it: standard deviation tells you how far numbers usually are from the average.
If the standard deviation is small, the numbers are close together. If it is large, the numbers are spread out. That is the heart of the concept. The formulas are just the machinery behind the curtain.
Think of a group of friends deciding when to arrive at a party. If everyone arrives between 7:00 and 7:10, the arrival times have a small standard deviation. If one person arrives at 6:30, another at 8:45, and someone strolls in at 10:15 holding tacos, the standard deviation is much larger.
Real-World Example: Standard Deviation of Weekly Sales
Suppose a small business records weekly sales for five weeks:
$900, $1,000, $1,100, $950, $1,050
The mean is:
(900 + 1000 + 1100 + 950 + 1050) / 5 = 5000 / 5 = 1000
Now subtract the mean:
-100, 0, 100, -50, 50
Square the deviations:
10000, 0, 10000, 2500, 2500
Add them:
25000
If this is the full population of interest, divide by 5:
25000 / 5 = 5000
Take the square root:
√5000 ≈ 70.71
The population standard deviation is about $70.71. That means weekly sales typically vary by around $71 from the average of $1,000. For a small business, that may suggest fairly stable weekly performance.
When Should You Use Standard Deviation?
Use standard deviation when you want to understand spread, consistency, volatility, or risk. It works best with numerical data and is especially helpful when the mean is a meaningful center point.
You might use it to compare:
- Test score consistency between two classes
- Monthly revenue stability between two products
- Delivery time reliability between two shipping services
- Stock price volatility between two investments
- Production measurements in quality control
However, standard deviation is sensitive to outliers. One extreme value can increase it significantly. If your data contains unusual values, you may also want to look at the median, interquartile range, or a box plot for a fuller picture.
Experience-Based Tips for Learning Standard Deviation
After working with standard deviation in real classroom-style examples, business spreadsheets, and data explanations, one lesson becomes very clear: most people do not struggle with the idea of standard deviation; they struggle with the steps. The concept is simple. The workflow is where the gremlins sneak in wearing tiny math shoes.
The best way to learn it is to slow down and label everything. Write the mean clearly. Create a column for deviations. Create another column for squared deviations. Then add the squared deviations. This table-based approach turns the calculation from a foggy mental maze into a neat checklist. Once you see the pattern, the process becomes surprisingly calm.
Another helpful experience is to compare two data sets with the same mean. For example, compare 8, 9, 10, 11, 12 with 2, 6, 10, 14, 18. Both have a mean of 10, but the second set is much more spread out. When learners see that the average can stay the same while the spread changes dramatically, standard deviation suddenly feels useful instead of decorative.
It also helps to connect the result to a real unit. If you are calculating standard deviation for heights in inches, the answer is in inches. If you are calculating it for sales in dollars, the answer is in dollars. This is one reason standard deviation is easier to interpret than variance. Variance has squared units, which can feel abstract. Standard deviation brings the answer back to the original measurement, where normal humans live.
A practical tip: use technology, but do not let it replace understanding. Excel, Google Sheets, graphing calculators, and statistics software can calculate standard deviation instantly. That is fantastic. But if you do not understand whether to choose sample or population standard deviation, the software may give you a correct answer to the wrong question. That is like getting beautiful driving directions to the wrong city.
When teaching or learning this topic, I recommend doing one full hand calculation first. Use a small data set with five or six numbers. After that, use a spreadsheet to check your answer. This builds confidence and shows how the formula works. Once the foundation is solid, technology becomes a helpful assistant instead of a mysterious black box.
Finally, remember that standard deviation is not a judgment. A high standard deviation is not automatically bad, and a low standard deviation is not automatically good. It depends on the situation. Low variation is excellent when manufacturing airplane parts or measuring medicine dosage. Higher variation may be expected in creative industries, sales trends, weather patterns, or startup growth. The number tells a story, but you still need context to understand the plot.
Conclusion
Standard deviation is a powerful way to understand how much your data varies from the average. To calculate it, find the mean, subtract the mean from each value, square the deviations, add them together, divide by the correct denominator, and take the square root. The process may look long at first, but once you practice it, the steps become predictable and even oddly satisfying.
The most important decision is whether your data is a population or a sample. Use the population formula when you have every value in the group. Use the sample formula when your data represents only part of a larger group. From there, standard deviation becomes a practical tool for analyzing consistency, risk, performance, and variation in everyday data.
In short, standard deviation helps you see whether your numbers are politely standing in line or chaotically running through the statistical sprinkler. Either way, now you know how to measure the spread.