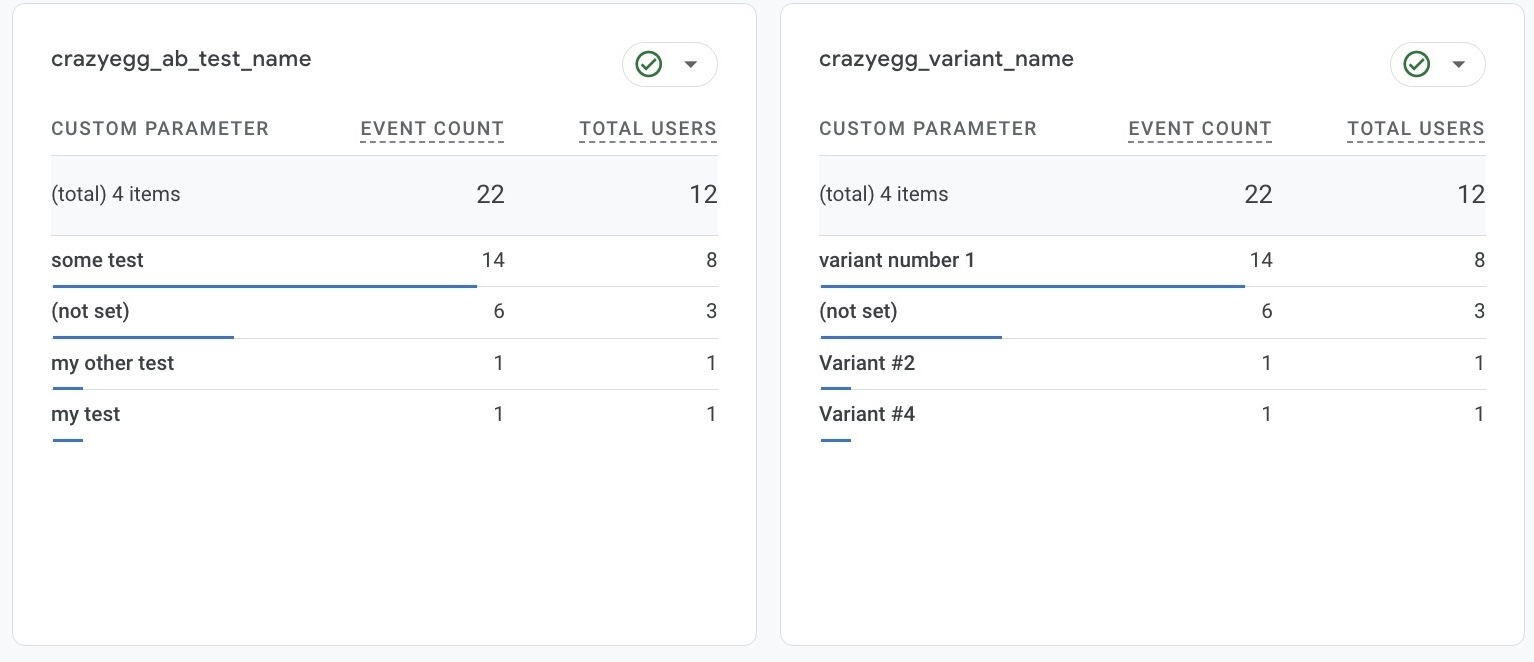
Running an A/B test used to involve a familiar analytics scavenger hunt. One platform showed which variation won, another showed where the visitors came from, and a third attempted to explain why half of them clicked a decorative icon instead of the enormous “Buy Now” button.
Crazy Egg’s Google Analytics 4 integration for A/B tests is designed to bring those clues closer together. Released on April 1, 2026, the integration sends information about viewed Crazy Egg test variants into GA4 as custom event data. Marketers can then compare variations using GA4 engagement metrics, traffic dimensions, audience segments, key events, and ecommerce data.
The result is more than another line in an analytics report. It creates a practical bridge between Crazy Egg’s visual behavior tools and GA4’s quantitative measurement system. Heatmaps and session recordings help explain what visitors did on a variation, while GA4 helps determine who those visitors were, where they came from, and whether their behavior contributed to meaningful business outcomes.
What the Crazy Egg GA4 Integration Actually Does
When a visitor is shown a variation in a Crazy Egg A/B test, Crazy Egg can send a custom event to the GA4 property installed on the website. The event is named crazyegg_variant_view.
That event identifies both the experiment and the specific variation viewed. Instead of seeing all visits to a tested page mixed into one analytics bucket, a team can distinguish visitors who saw the original page from those who saw variation B, variation C, or another version.
Information included with the variant-view event
The integration provides custom parameters for the following details:
- The Crazy Egg A/B test ID
- The Crazy Egg A/B test name
- The variation ID
- The variation name
- A combined test-and-variation value for easier reporting
Once these parameters are registered as event-scoped custom dimensions in GA4, they can be used in reports and Explorations. That makes it possible to place a variation name next to metrics such as sessions, engagement rate, average engagement time, event count, key events, purchases, and revenue.
The integration does not magically turn GA4 into a cheerful, mind-reading conversion consultant. It does, however, give GA4 the missing label that says, “This visitor saw variation B.” That small piece of context is what makes meaningful experiment segmentation possible.
How this differs from the broader GA4 connection
Crazy Egg also introduced a broader Google Analytics connection in February 2026 that allows users to view GA4 traffic data through Crazy Egg’s Web Analytics interface. The A/B testing integration serves a different purpose: it sends experiment and variation information from Crazy Egg into GA4.
Think of the broader connection as bringing GA4 data into a cleaner Crazy Egg dashboard. The A/B test integration moves variation-view data in the other direction so analysts can study experiments within the wider GA4 measurement environment.
Why Combining GA4 and Crazy Egg A/B Testing Matters
An experiment dashboard may tell you that variation B generated more conversions than the original. That is useful, but it immediately raises additional questions. Did variation B perform better for every visitor? Was the lift driven almost entirely by mobile traffic? Did paid search visitors love it while returning customers disliked it? Did it increase purchases but reduce average order value?
These are the questions GA4 segmentation can help answer.
Move beyond the overall conversion rate
An overall average can hide important differences between audiences. Suppose a redesigned product page produces a 9% lift in add-to-cart actions. After segmenting the results, the team discovers a 22% improvement on smartphones but almost no change on desktop computers.
That finding is more useful than simply declaring a universal winner. The company might prioritize the new design for mobile traffic, examine why desktop visitors responded differently, or create a follow-up test specifically for larger screens.
Connect acquisition data with experiment performance
Because the variation event sits inside GA4, marketers can study performance by source, medium, campaign, landing page, referrer, country, browser, and device category. A landing-page headline can therefore be evaluated against the advertising message that brought visitors to the page.
For example, visitors from an advertisement emphasizing affordability may respond well to a variation that leads with price. Organic visitors researching product quality may prefer the original page, which highlights materials, reviews, and durability. Without traffic-source segmentation, those opposing reactions might cancel each other out and make a useful experiment look inconclusive.
Add behavioral evidence to statistical results
GA4 can show that a variation had a lower engagement rate or fewer key events. Crazy Egg heatmaps and session recordings can help reveal why.
Perhaps the new hero image pushed important information below the fold. Maybe visitors repeatedly clicked a product photo that was not linked. A form could be visually confusing, or a sticky banner might cover the checkout button on smaller screens. Quantitative analytics identifies the performance difference; visual behavior analytics supplies the detective work.
How to Set Up the Crazy Egg and GA4 A/B Test Integration
The correct setup depends on how GA4 is installed on the website. A site using the Google tag directly follows one route, while a site using Google Tag Manager requires an additional GTM configuration.
Option 1: GA4 installed directly with the Google tag
When GA4 is installed directly on the website, Crazy Egg can send its variant-view event to the existing Google tag. The main administrative task is registering the Crazy Egg event parameters as custom dimensions in GA4.
In the selected GA4 property, open Admin, find Data display, and select Custom definitions. Create event-scoped custom dimensions for these parameters:
crazyegg_ab_test_idcrazyegg_ab_test_namecrazyegg_variant_idcrazyegg_variant_namecrazyegg_ab_test_and_variant
Use clear display names such as “Crazy Egg AB Test Name” and “Crazy Egg Variant Name.” The display name is what analysts see in GA4; the event parameter must match the technical parameter exactly. One missing underscore can turn a tidy reporting plan into an afternoon of staring suspiciously at an empty table.
Option 2: GA4 installed through Google Tag Manager
Websites that deploy GA4 through Google Tag Manager need a tag capable of receiving the Crazy Egg information and forwarding it to the correct GA4 measurement ID.
Crazy Egg provides an importable GTM container file for this purpose. The general workflow is:
- Download the Crazy Egg GA4 GTM integration container file.
- Open the appropriate container in Google Tag Manager.
- Create or select a dedicated workspace.
- Import the Crazy Egg container file.
- Choose the merge option and review potential conflicts carefully.
- Open the imported Crazy Egg Variant View tag.
- Confirm that it uses the correct GA4 measurement ID.
- Preview, test, and publish the container changes.
- Create the five event-scoped custom dimensions in GA4.
Using a separate GTM workspace is a sensible precaution. It isolates the integration changes, simplifies review, and makes accidental edits less likely. “Overwrite everything and hope” is not an analytics strategy, even when the button looks confident.
Confirm the integration before launching a major test
After setup, visit a page included in an active Crazy Egg experiment. Open GA4’s Realtime report and look for the crazyegg_variant_view event. Selecting the event should reveal associated parameters such as the test ID and variation name.
For more detailed troubleshooting, enable GA4 debug mode and use DebugView. Google Tag Manager users should also run the site through GTM Preview or Tag Assistant. Confirm that:
- The correct GTM container loads on the tested page.
- The expected GA4 measurement ID is being used.
- The Crazy Egg variation tag fires once the variation is displayed.
- The event reaches the intended GA4 property.
- The variation parameters contain readable, expected values.
Realtime verification can happen quickly, but processed GA4 reports may take 24 to 48 hours to stabilize. Do not dismantle a working integration simply because yesterday’s custom report has not awakened from its nap yet.
How to Analyze Crazy Egg Variations in GA4
Once the event and custom dimensions are available, GA4 Explorations provide the most flexible environment for analysis.
Build a simple variation comparison
Create a free-form Exploration and import the Crazy Egg test-and-variation dimension. Add it as a row, then add relevant metrics as values. A useful starter report might include:
- Active users
- Sessions
- Engaged sessions
- Engagement rate
- Average engagement time
- Event count
- Key events
- Purchases or total revenue for ecommerce tests
Filter the Exploration to the crazyegg_variant_view event or to the specific Crazy Egg test name. This keeps unrelated website activity from wandering into the report like a neighbor who smelled barbecue.
Segment by audience and acquisition channel
Add device category, country, session source/medium, campaign, browser, new versus established users, or landing page as secondary dimensions. These breakdowns can uncover where a variation’s lift is concentrated.
Keep segmentation disciplined. Looking at dozens of tiny slices increases the likelihood of finding random differences that appear important but disappear with more data. Begin with segments connected to the test hypothesis, such as mobile visitors for a mobile navigation test or paid campaign traffic for a message-matching experiment.
Connect variation exposure to a funnel
A funnel Exploration can begin with the Crazy Egg variation-view event and continue through important actions such as viewing a product, beginning checkout, submitting a lead form, or purchasing.
This approach reveals where the effect occurred. A variation might increase clicks on the primary call to action without improving completed purchases. Another variation may attract fewer initial clicks but send better-qualified visitors into the final conversion steps.
Not every higher click-through rate deserves a trophy. Sometimes it is merely an enthusiastic detour.
Practical Use Cases for the Integration
Ecommerce product-page optimization
An online retailer can test a shorter product description against a detailed version. GA4 can compare add-to-cart rate, checkout starts, purchases, revenue, and traffic channels for each variation. Crazy Egg recordings can reveal whether visitors scroll through the long description, interact with product galleries, or struggle to locate shipping information.
SaaS pricing-page experiments
A software company might test monthly pricing against annual-pricing-first messaging. GA4 can show which version produces more sign-up starts and completed registrations, while segmentation reveals whether new visitors and returning prospects behave differently.
Heatmaps may show that one variation attracts attention to the recommended plan but accidentally reduces interaction with the feature comparison table. That insight can inspire a more focused follow-up test.
Lead-generation landing pages
A service business can test a short form against a longer qualification form. The short version may produce more submissions, but downstream CRM data could reveal that the longer form produces stronger leads. GA4 events can measure browser-side form completion, while Crazy Egg recordings help identify fields that cause hesitation or abandonment.
Campaign message matching
Marketers can compare a general landing page with a variation tailored to a specific advertisement. GA4 campaign dimensions make it possible to determine whether message matching improves engagement and conversion performance for the intended campaign without affecting other traffic.
Common Mistakes That Can Distort the Results
Using the wrong GA4 property or measurement ID
Organizations with development, staging, regional, and production properties can easily send test events to the wrong destination. Verify the measurement ID in both the website installation and the imported GTM tag.
Skipping the custom-dimension setup
GA4 may receive the custom event even when its parameters have not been registered for reporting. The event count will appear, but analysts may be unable to use test and variation names conveniently in reports. Create the custom definitions before the experiment begins and confirm them during quality assurance.
Comparing raw event totals instead of rates
A variation receiving more traffic will usually generate more events. Compare normalized outcomes, including key-event rate, engagement rate, revenue per user, or purchase rate, rather than declaring a winner because one column contains a larger number.
Stopping a test after an early spike
Experiment results fluctuate, especially when traffic is limited. A variation that looks spectacular on Tuesday morning may become painfully ordinary by Friday. Define the primary metric, minimum runtime, required sample, and decision rules before examining the outcome.
Ignoring consent and tag behavior
GA4 collection depends on the site’s consent configuration and visitor choices. Validate the experience both before and after analytics consent is granted. The measurement plan should respect applicable privacy requirements and the organization’s consent policy rather than attempting to collect data by creative surprise.
Assuming server-side events are visible to Crazy Egg
There are two data directions to understand. Crazy Egg can send variation-view information to GA4. Separately, Crazy Egg can use GA4 events as conversion triggers when those events fire in the visitor’s browser.
If a purchase or lead event exists only in server-side GTM, a backend service, or a cloud-only customer data platform workflow, Crazy Egg cannot observe it in the browser. Teams using server-side conversion measurement should maintain an appropriate client-side signal or use a supported Crazy Egg conversion-tracking method.
Experience-Based Lessons for a Smoother Implementation
The most successful implementation pattern is to treat the integration as a measurement project, not as a five-minute checkbox exercise. The technical connection is only the first step. Naming, quality assurance, experiment design, and reporting discipline determine whether the data becomes useful.
Start with a small validation experiment
Before connecting the integration to a high-traffic checkout test, begin with a controlled experiment on a lower-risk page. Create two clearly named variations, visit the test page using multiple browsers or devices, and confirm that each exposure appears with the expected parameter values.
This small rehearsal often uncovers mundane but important issues: the staging site uses the production GA4 property, the GTM container was never published, a consent rule prevents the event from firing, or the variation was named “Copy 2 final FINAL new.” None of these problems is statistically fascinating, but each can make the final report miserable.
Use names that remain understandable months later
A practical naming structure includes the page, tested element, audience, and launch period. For example, “Pricing Page – Annual Plan Emphasis – All Traffic – Q3 2026” is more useful than “Pricing Test 7.” Variation names should describe the actual treatment, such as “Control,” “Annual Price First,” and “Savings Badge Plus Annual Price.”
Clear naming improves GA4 analysis because report rows explain themselves. It also helps when several experiments are active or when analysts revisit historical results after the original campaign team has moved on.
Agree on one primary decision metric
Teams frequently connect GA4 and immediately add every available metric to the report. More columns do not automatically create more wisdom. Choose one primary metric that represents the experiment’s business objective, then define a limited number of supporting and guardrail metrics.
For a checkout test, purchase rate may be primary, while revenue per user, refund rate, and page errors serve as guardrails. For a lead-generation test, completed form submissions may be primary, while qualified-lead rate is evaluated later. Engagement metrics can explain behavior, but they should not quietly replace the original business goal.
Review the numbers and recordings together
A productive review meeting begins with GA4 performance by variation and priority segment. The team then examines Crazy Egg heatmaps and selected recordings to develop explanations for the observed differences.
For instance, GA4 may show that a variation improves conversions on desktop but harms mobile performance. Mobile recordings might reveal that the new call-to-action overlaps a chat widget. That is not evidence that the entire concept failed; it is evidence that the mobile implementation needs repair.
This workflow prevents two common extremes: making decisions from a handful of dramatic recordings or trusting an aggregate metric without understanding the visitor experience.
Expect small differences between platforms
Crazy Egg and GA4 may not display identical totals because they can use different session logic, consent states, filtering rules, processing schedules, bot handling, and event timing. The goal is not always perfect numerical equality. The goal is consistent assignment and a reliable directional comparison between variations.
Investigate large discrepancies, especially when one variation is missing or the traffic allocation is unexpectedly uneven. Minor differences are less alarming when both systems show the same general pattern and the implementation has passed browser-level testing.
Document the final decision
At the end of the test, save the hypothesis, dates, audiences, primary metric, GA4 Exploration, Crazy Egg findings, result, limitations, and next action. A losing variation can still produce valuable knowledge, and an inconclusive test can identify the next question.
Without documentation, the organization may repeat the same test six months later under a new name. That technically creates more data, but it is a rather expensive way to experience déjà vu.
Final Takeaway
The Crazy Egg GA4 integration for A/B tests gives optimization teams a more complete view of experiment performance. The crazyegg_variant_view event connects each viewed variation with GA4’s engagement, acquisition, audience, funnel, key-event, and revenue data.
Crazy Egg then adds the behavioral layer through heatmaps and session recordings. Together, the tools help teams answer three essential questions: Which variation performed better? For which visitors did it perform better? What behavior likely caused the difference?
The integration will not replace a clear hypothesis, reliable conversion tracking, sufficient traffic, or patient analysis. It does make those practices more powerful by reducing the gap between an experiment result and the wider customer journey. Configure the custom dimensions, validate the event before launch, segment with purpose, and use behavioral evidence to explain the numbers. Your analytics stack may still have plenty of tabs, but at least those tabs will finally be discussing the same experiment.