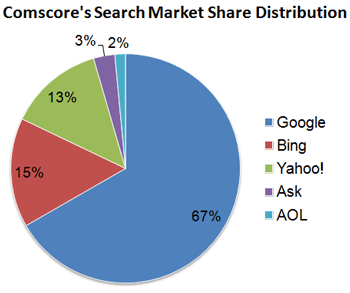
Search market share numbers have a magical way of turning smart people into headline parrots. One chart shows Google at one level, another tracker shows a totally different picture, and suddenly marketers are acting like the internet has split into parallel universes. That confusion is exactly why SparkToro’s critique of Comscore still matters. The issue was never that measurement firms are evil cartoon villains twirling mustaches over spreadsheets. The issue is much simpler and much more dangerous: people treat a narrow measurement model as if it were the whole truth.
If you work in SEO, digital marketing, publishing, or media analysis, this matters more than it sounds. Search market share figures influence budget decisions, platform strategy, PR narratives, and sometimes even antitrust conversations. When one vendor’s number becomes the number, nuance gets flattened faster than a pancake under a steamroller. And in search, nuance is everything.
The Core Problem: “Market Share” Sounds Cleaner Than It Really Is
The phrase search market share feels precise. It sounds like the kind of thing you can measure with a ruler, a calculator, and a very serious face. But search is not one uniform action happening in one place, on one device, under one definition. Search happens on desktop, on mobile, inside browsers, through default bars, through partner experiences, within vertical properties, and across multiple types of user intent.
That is where Comscore’s numbers became controversial. SparkToro’s argument was not merely “Comscore bad.” The deeper point was that Comscore’s published figures were often interpreted as a broad snapshot of actual search engine dominance when they were really a narrower view shaped by how Comscore defined the search universe, how it grouped sites, and what kinds of activity it counted.
Once you understand that distinction, the entire debate becomes less about accusing one company of fraud and more about recognizing the oldest analytics problem on the web: what you measure determines the story you tell.
Why SparkToro Called the Numbers Misleading
1. Comscore counted “sites,” not just classic search engines
One of the most important critiques is also the easiest to miss. In Comscore’s older qSearch framework, the reporting categories were not always just pure engines in the way everyday people imagine them. They were entities like Google Sites, Yahoo! Sites, and Microsoft Sites. That sounds harmless until you realize those labels can pull in more than a single flagship search box.
That matters because the public hears “Bing” or “Yahoo” and imagines a traditional web search engine. Measurement systems, however, may count a broader family of properties, partner searches, or cross-channel behavior. Once you mix multiple site experiences into a single bucket, the resulting share number is not a clean measure of classic engine-to-engine competition. It is a model of activity across a defined entity set.
In plain English: if your label says “apple,” but you also tossed in pears, grapes, and one confused tomato, your fruit bowl statistics become less helpful.
2. Desktop-only or desktop-heavy views can distort the big picture
Another major criticism was the historical lack of mobile inclusion in the numbers many reporters cited. That is not a tiny footnote. It is a neon sign. Search behavior differs dramatically by device, and Google has long been especially strong on mobile search. So if a public number leans heavily on desktop activity, it may materially understate Google’s overall real-world dominance.
This is one reason old mid-60s figures for Google often felt strange to practitioners. SEOs looking at their own analytics, publishers reviewing referral logs, and marketers studying traffic patterns often saw Google contributing a far larger portion of search visits than those famous Comscore headlines implied. SparkToro argued that the gap was not random. It came from the measurement frame itself.
3. The sample can shape the outcome more than people realize
Comscore has long positioned itself as a serious measurement company, and to be fair, methodology companies all face hard trade-offs. But sample construction matters. A lot. A panel, network, or observed dataset can be statistically useful without being universally representative for every question people want to ask. That is a crucial difference.
Even Comscore’s own historical discussion of discrepancies with other firms showed how different data sources could lean toward different user groups and distribution environments. When a measurement approach reflects certain providers, traffic sources, or browsing patterns more heavily than others, market share results can move in a meaningful way. This does not automatically invalidate the number. It does, however, limit what claims should be built on top of it.
4. “Explicit core search” is not the same thing as total search behavior
To its credit, Comscore eventually introduced distinctions such as core search and explicit core search to separate more direct search intent from context-driven or inflated activity. That change was useful. It added transparency and acknowledged that not every action counted as a search belongs in the same basket.
But the public relations problem remained. Once a monthly market share chart gets picked up by the media, most people do not stop to ask what “explicit core search” excludes, what “core search” includes, whether the data is U.S.-only, whether it is desktop-only, or whether the reporting entity is a search engine, a network, or a family of properties. They just see the percentage and run with it like it stole their wallet.
Why Other Data Sources Often Tell a Different Story
Comscore is not the only company trying to map digital behavior, and that is exactly why SparkToro’s critique has aged well. When multiple reputable sources with different methods produce very different pictures, the responsible reaction is not blind loyalty. It is methodological skepticism.
Statcounter measures usage differently
Statcounter’s public search engine share data is based on a massive volume of page views across a huge network of websites. Its methodology emphasizes observed web usage rather than a classic opt-in toolbar model, and it has long produced figures that place Google far higher than the older Comscore headlines did. That alone does not make Statcounter perfect. It does show that the answer depends on what kind of behavior is being tracked.
Similarweb relies on blended digital signals and modeling
Similarweb uses a different approach again: first-party measurement, contributory network data, partnerships, public data extraction, and predictive modeling. That kind of blended method can be useful for estimating large-scale digital behavior, but it also reminds us that modern measurement is often part direct observation and part informed modeling. Useful? Yes. Gospel? No.
Pew and practitioner analytics add another angle
Survey-based research from Pew has historically shown strong self-reported dominance by Google among U.S. users, while publishers and SEO teams often see their own referral data lean heavily toward Google as well. These are not interchangeable with market share studies, but they are important reality checks. If one number says Google is merely ahead while nearly every other practical indicator says Google is overwhelmingly dominant, you should probably pause before tattooing the first number onto your strategy deck.
The Media’s Favorite Mistake: Turning One Vendor’s Metric into Objective Truth
This is where the real trouble starts. Media outlets love neat charts. Investors love simple comparisons. Marketing teams love a slide that appears to settle a debate without requiring anyone to read a methodology document longer than a cereal box. So a vendor metric escapes its original context and becomes “the market.”
That is how confusion spreads. A measurement company publishes a specific type of ranking for a defined slice of behavior. Trade publications summarize it. Other outlets repeat the summary. Agencies cite the outlets. Executives quote the agencies. Before long, a conditional, limited, methodology-dependent data point is treated like a law of physics.
And unlike physics, digital measurement gets messier every year.
Search in 2026 Is Even Harder to Measure Than Search in 2012
If the old Comscore debate felt thorny, today’s search landscape is a whole haunted corn maze. Modern search is no longer just ten blue links on a desktop browser. It includes mobile behavior, zero-click results, maps, shopping, image search, app ecosystems, AI-assisted answers, and discovery experiences that blur the line between search, recommendation, and navigation.
That means any claim about total search market share should come with a label that says, “Contents may shift during transport.” Search Engine Land and Search Engine Journal now commonly reference public datasets that put Google around or above 90% globally, while advertising analysts such as EMARKETER talk about a different idea altogether: search ad market share. Those are not the same thing. Query share and ad revenue share are cousins, not twins.
And then there is another metric that marketers sometimes confuse with both: share of search. SEMrush uses that phrase to describe the proportion of branded searches a company earns relative to competitors in its category. Useful? Absolutely. Equivalent to overall engine market share? Not even a little.
So now we have at least three different concepts floating around:
- search engine query share
- search advertising share
- brand share of search
They sound similar enough to confuse a room full of professionals, which is why skepticism is not optional. It is job equipment.
What Comscore Got Right, and Where People Went Wrong
To be fair, Comscore was trying to solve a genuinely difficult problem. Search behavior had expanded beyond the classic search box, and the company acknowledged that by refining categories like core search and explicit core search. That was a legitimate attempt at more transparent measurement, not a confession of villainy.
The bigger failure was how the numbers were consumed. Too many people treated a specialized measurement output as a universal truth about who owns search. That is not only an interpretation problem. It is a strategy problem. If you assume one public metric defines the whole market, you risk allocating resources badly, misunderstanding your audience, and drawing the wrong lessons from your own analytics.
Google’s own ecosystem and the U.S. antitrust fight over search distribution also remind us that search dominance is shaped by defaults, devices, distribution agreements, and user habits, not just raw query counts in a desktop panel. In other words, the market is not merely about who gets typed into a browser. It is about access, behavior, habit, and context.
What Smart Marketers Should Do Instead
Use multiple sources, not one sacred chart
If you want a serious view of search market dynamics, compare methodologies. Look at public usage trackers, platform docs, traffic referral data, survey research, advertising reports, and your own analytics. No one source is complete. Together, they can tell a more honest story.
Ask what is being counted
Before repeating any market share statistic, ask:
- Is this desktop only, mobile only, or blended?
- Is it U.S.-only or global?
- Are these search engines, site groups, or partner entities?
- Does it count explicit intent, contextual activity, or both?
- Is this query share, ad share, traffic share, or brand share of search?
If you cannot answer those questions, you probably should not be using the number to make a dramatic argument on LinkedIn.
Trust your own analytics for operational decisions
If your website gets 88% of its search traffic from Google, 9% from Bing, and a tiny sliver from everywhere else, that is the reality your business has to operate in. It does not matter if a vendor’s chart says something slightly different about some broader national sample. Industry numbers are context. Your data is consequences.
Real-World Experiences From the SEO Trenches
Anyone who has worked in SEO for more than five minutes and one coffee refill has seen this problem in action. A leadership team spots a headline saying Google has “only” some lower share number than expected, and suddenly the room decides Bing optimization deserves equal staffing, equal content investment, and equal emotional energy. Then the analytics team opens the referral dashboard and the whole theory collapses like a folding chair at a backyard cookout.
One common experience goes like this: a publisher sees that nearly all organic traffic comes from Google, with Bing and Yahoo contributing modest but still meaningful slices. Then an executive waves around a public market share chart and asks why those engines are not sending more traffic “if the market is so balanced.” The answer is usually not incompetence. It is measurement mismatch. Public market share numbers may describe one dataset, while the publisher’s audience, device mix, geography, and content vertical describe another reality entirely.
E-commerce teams often run into a version of this too. In some categories, Bing traffic converts surprisingly well, especially on desktop-heavy audiences with older demographics or more workplace usage. That can make Bing strategically important even if its overall share is far smaller than Google’s. So the mistake cuts both ways. Comscore-style numbers can make smaller players look larger than they are in the abstract, while performance data can still show that those smaller players matter a lot in specific niches.
Agencies see the same drama during client onboarding. A client has heard that Google’s dominance is slipping, maybe because they read a trade story about global share dipping below a symbolic threshold or because AI search tools are getting buzz. They assume that the whole search ecosystem is suddenly level. But once campaign and analytics data are reviewed, the picture is more grounded. Google still dominates visibility and traffic for most sites, Bing can punch above its weight in certain verticals, and alternative search experiences matter more for discovery strategy than for raw replacement of traditional search demand.
There is also the recurring problem of dashboard translation. Analysts know the difference between search traffic share, search engine market share, and paid search ad share. Executives often hear “search share” and mentally toss all three into one blender. That is how bad strategy smoothies get made. Teams end up debating whether Google is “losing” search when one source is talking about ad spend, another is talking about browser defaults, and a third is talking about branded search demand.
The best operators learn to resist the temptation of one heroic metric. They compare multiple sources, annotate the caveats, and then bring everything back to the same practical question: what does this mean for our audience, our site, and our revenue? That mindset is far more valuable than winning an argument about whose chart looks prettier on a slide.
In that sense, SparkToro’s old warning still feels fresh. The lesson was never just about Comscore. It was about intellectual discipline. When a market is this complex, trusting one number without interrogating the method is not analysis. It is horoscope reading with better typography.
Conclusion
So, can you trust Comscore’s search market share numbers? You can trust them to reflect a methodology. You cannot trust them to represent the entire search universe without qualifications, caveats, and context. That distinction is the whole story.
SparkToro’s critique remains valuable because it teaches a habit that every marketer should keep: when a metric becomes a headline, inspect the measurement before you believe the narrative. In search, the truth is rarely hiding in one percentage point. It is hiding in the definition underneath it.